Trends
This dashboard shows visual reports related to various trends.
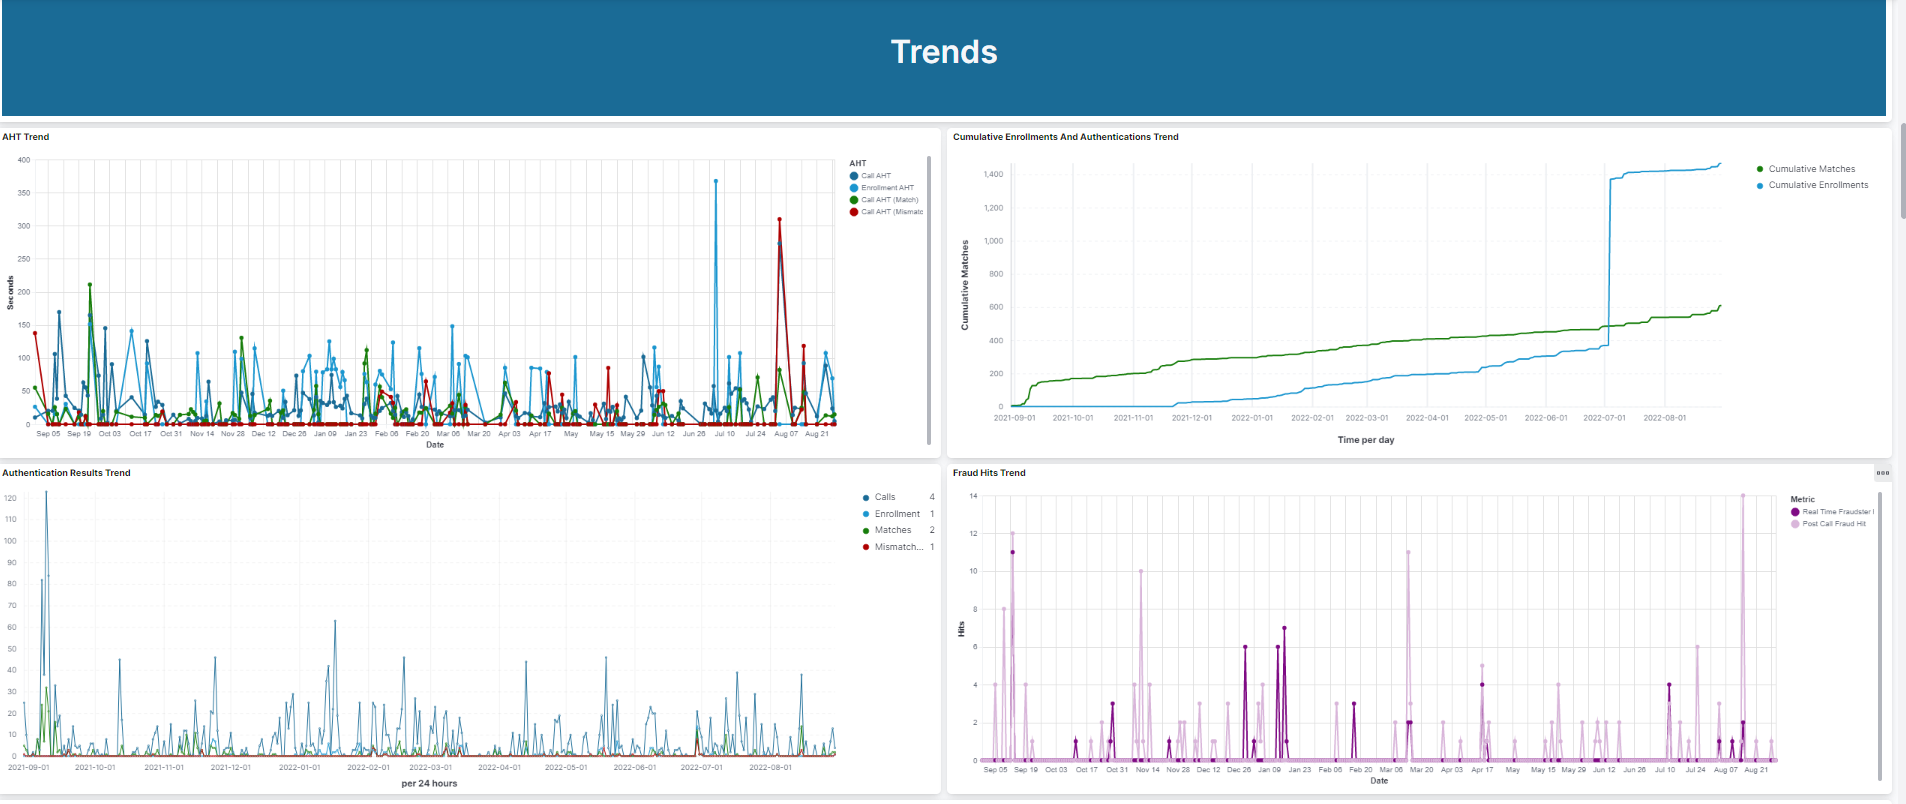
AHT Trend line chart
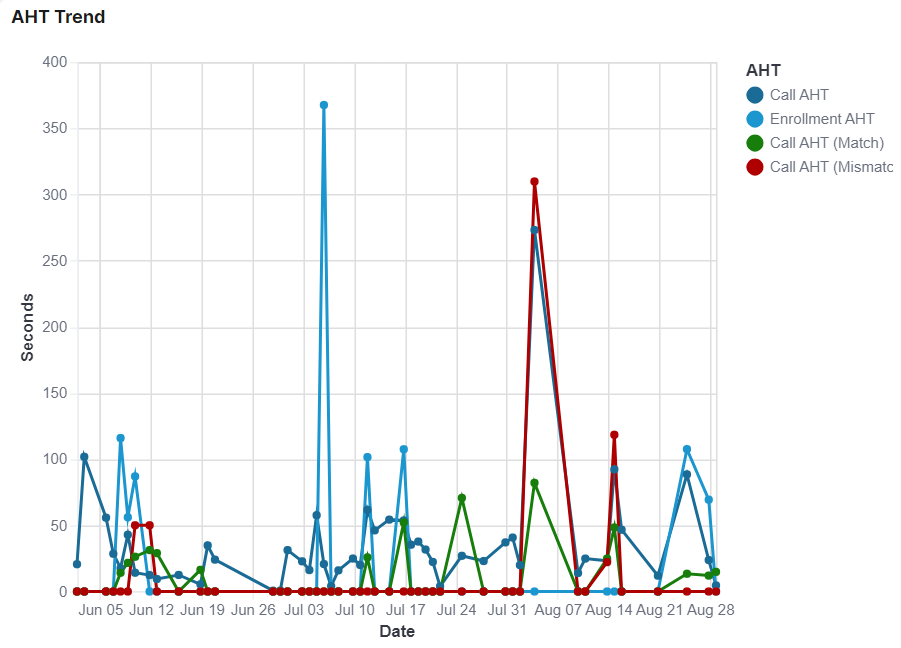
The following table describes the elements of the AHT Trend line chart:
| Element | Description |
|---|---|
| Visualization | AHT Trend |
| Description | Displays daily handle time trends for contact center:
|
| Type | Line chart created using Vega |
| Filter | Engagement creation timestamp (date and time) KQL language |
| Implicit Filter | The widget selects SESSION_TYPE_CALL_CENTER and identifies Net New Enrollments. The query to identify Net New Enrollments is based on a combination of initial and final train statuses, such as: initial_voiceprint_profile_train_status not equal VOICEPRINT_PROFILE_STATUS_BASIC_TRAINED AND initial_voiceprint_profile_train_status not equal VOICEPRINT_PROFILE_STATUS_OPTIMAL_TRAINED AND (final_voiceprint_profile_train_status equal VOICEPRINT_PROFILE_STATUS_BASIC_TRAINED OR final_voiceprint_profile_train_status equal VOICEPRINT_PROFILE_STATUS_OPTIMAL_TRAINED) |
| Linkable Entity | None |
Authentication Results Trend line chart
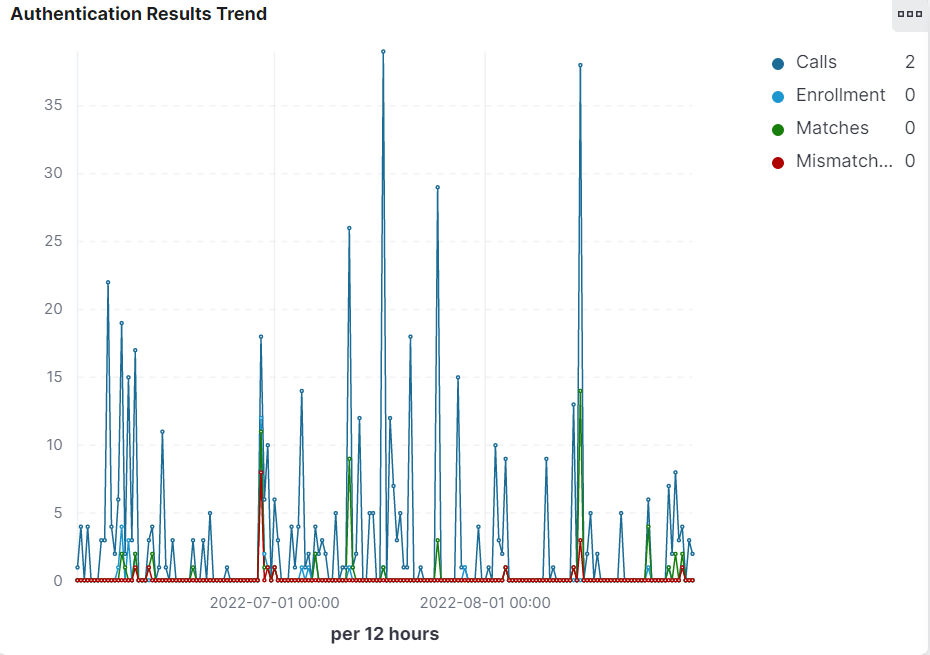
The following table describes the elements of the Authentication Results Trend line chart:
| Element | Description |
|---|---|
| Visualization | Authentication Results Trend |
| Description | Displays daily Authentication trends for Contact Center and IVR:
|
| Type | Line chart |
| Filter | Engagement creation timestamp (date and time) KQL language |
| Implicit Filter | The widget selects SESSION_TYPE_CALL_CENTER and SESSION_TYPE_IVR. |
| Linkable Entity | None |
Cumulative Enrollments and Authentications Trend line chart
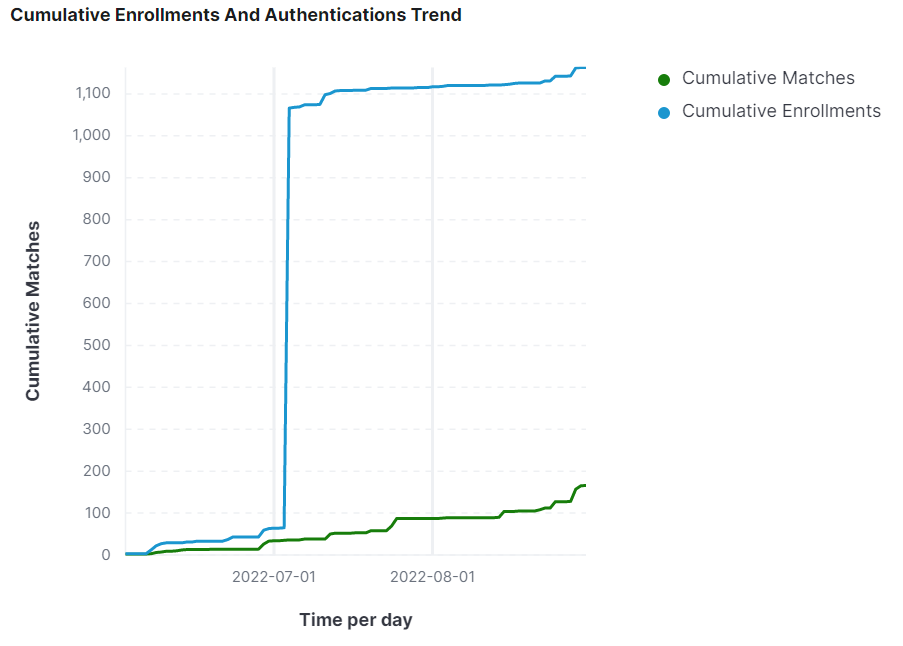
The following table describes the elements of the Cumulative Enrollments and Authentications Trend line chart:
| Element | Description |
|---|---|
| Visualization | Cumulative Enrollments And Authentications Trend |
| Description | Displays daily cumulative Authentication & Enrollment trends:
|
| Type | Line chart |
| Filter | Engagement creation timestamp (date and time) KQL language |
| Implicit Filter | The widget selects SESSION_TYPE_CALL_CENTER and identifies Net New Enrollments. The query to identify Net New Enrollments is based on a combination of initial and final train statuses, such as: initial_voiceprint_profile_train_status not equal VOICEPRINT_PROFILE_STATUS_BASIC_TRAINED AND initial_voiceprint_profile_train_status not equal VOICEPRINT_PROFILE_STATUS_OPTIMAL_TRAINED AND (final_voiceprint_profile_train_status equal VOICEPRINT_PROFILE_STATUS_BASIC_TRAINED OR final_voiceprint_profile_train_status equal VOICEPRINT_PROFILE_STATUS_OPTIMAL_TRAINED) |
| Linkable Entity | None |
Fraud Hits Trend line chart
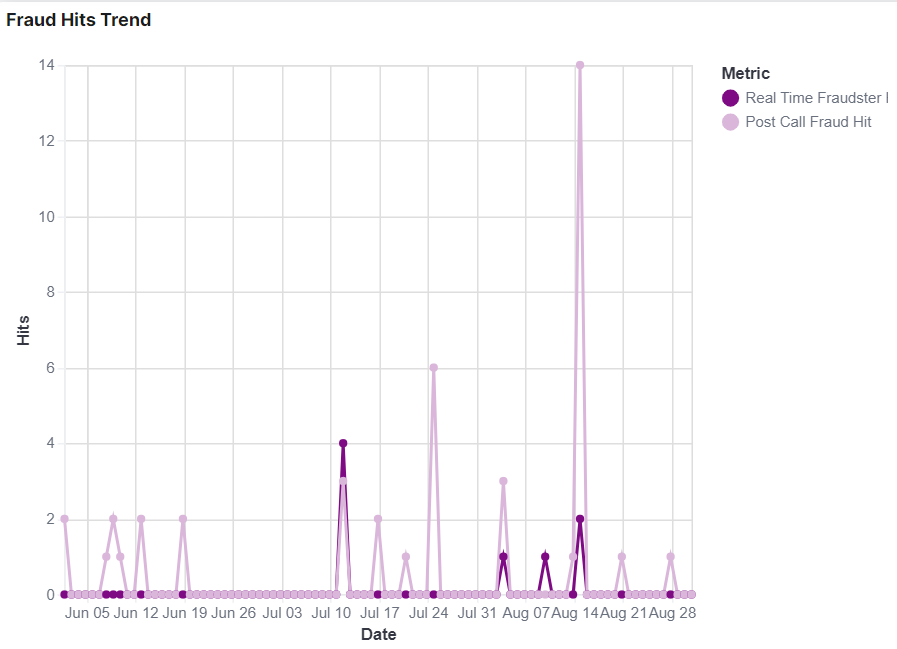
The following table describes the elements of the Fraud Hits Trend line chart:
| Element | Description |
|---|---|
| Visualization | Fraud Hit Trends |
| Description | Displays daily Fraud Hit Trends:
|
| Type | Line chart using Vega. |
| Filter | Engagement creation timestamp (date and time)KQL language |
| Implicit Filter | The widget selects SESSION_TYPE_CALL_CENTER or SESSION_TYPE_POST_CALL. |
| Linkable Entity | None |